

Case trends and predictions
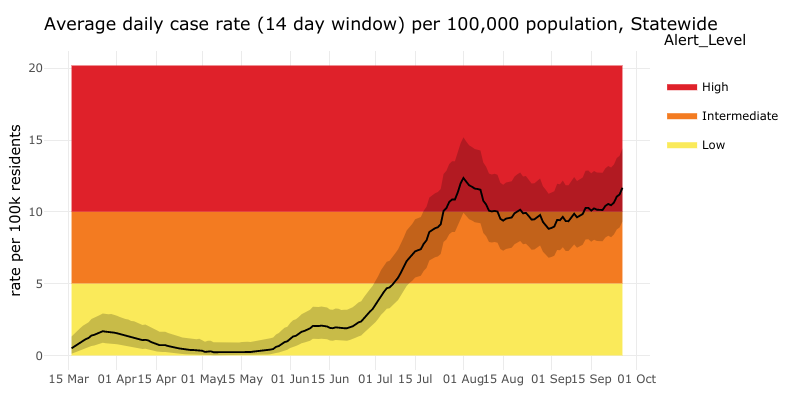
- Overall, new cases in Alaska are increasing, continuing a steady rise over the last six weeks. The daily state case rate, as of Sept. 26, is 11.7 cases per 100,000 people averaged over the last 14 days, so the state alert level continues to be high. This is up from 10.2 last week and 8.7 the week before.
- Compared to other states’ case rates, Alaska’s average case rate per capita over the last 7 days (12.9 average daily cases over the last week per 100,000) puts it around the middle of US states at #24, between Nevada (13.4) and Indiana (12.7). If Anchorage were its own state, its 7-day case rate (18.4) would put it at rank #19, between Wyoming (18.9) and North Carolina (18.3). Nationally, cases have been rising since mid-September, particularly in the Midwest but increases have been seen in most states this week.
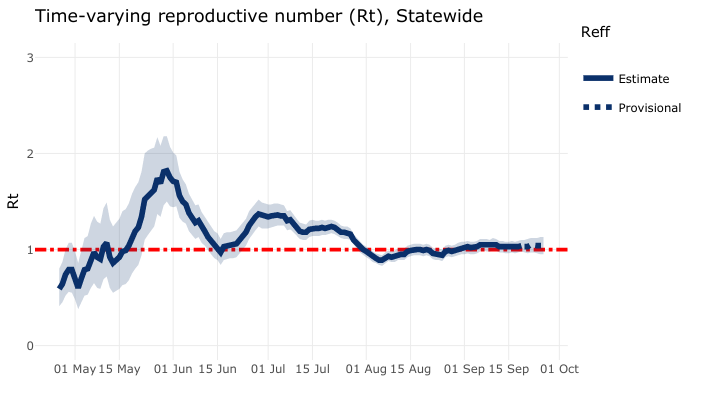
- The reproductive number, a measure of contagion, is currently estimated to be approximately 1.03. A reproductive number of 1 means that each person who is diagnosed with COVID-19 gives it on average to one other person. A reproductive number of more than 1 means that the epidemic is growing, and the goal is to have enough people wear masks, stay at least 6 feet from others, and stay home and get tested when they are sick that Alaska’s reproductive number decreases to well below 1. Our reproductive number was below 1 as recently as late August.
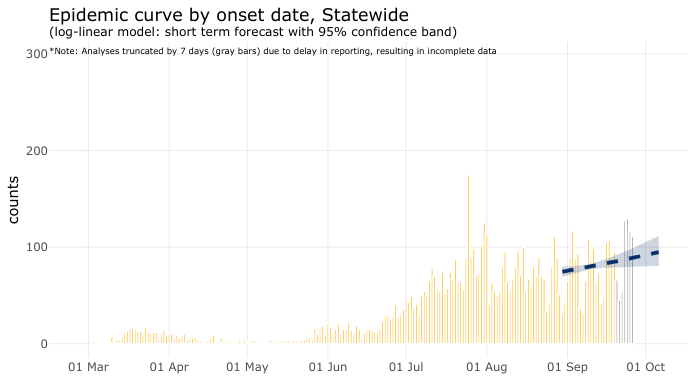
- An updated model epidemic curve predicts Alaska’s cases will continue to rise over the next week. One week ago, cases were now expected to double every 190 days, with a daily projected growth rate of 0.37%. This projection has worsened, with cases now expected to double around every 105 days, with a daily projected growth rate of 0.66%.
- Nonresident cases, which peaked in late July, decreased over August and continue to downtrend.
- Alaska continues to have the fewest COVID-19 related deaths per capita of any US state, but this week passed Wyoming in total number of deaths.
Regional trends
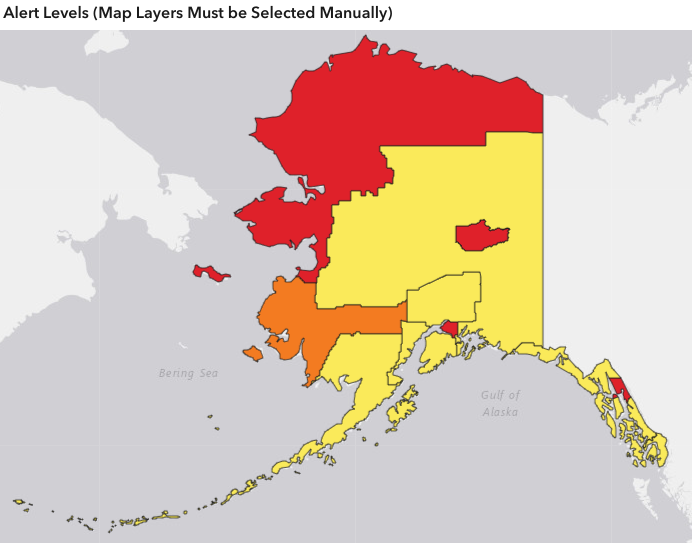
- The Northwest Region had the steepest increase this week among communities with high transmission, with a rate now at 27.9 from 15.6 the previous week, becoming the highest rate of new cases of any borough reported.
- Anchorage Municipality remains in the high transmission category but reversed its trend of slow improvement, instead worsening from 13.1 to 16.1, a jump that brings it similar to Fairbanks in terms of case transmission.
- Juneau City and Borough improved to 12.3 from 16.3 the week before.
- Fairbanks North Star Borough remains steady at a high case rate, 16.3 this week from 15.9 the week before and 17.1 the week before that.
- The Y-K Delta region increased from 8.4 to 8.7, remaining within the intermediate zone.
- The Interior Region, Kenai and Northern Southeast Region also saw increases this week and still remain in the low transmission zone.
- Other regions’ case rates downtrended or were stable and low this week.
Regional case trends
New cases, hospitalizations and deaths
- This week saw 645 new cases in Alaskans, an jump from last week’s 558 new cases, for a total of 7,481 cumulative cases in Alaskans. 4,308 of those are considered active, or 58%, as 3,173 Alaskans are thought to have recovered or completed their isolation period. Data on recovery lags data on new cases and may not be up to date.
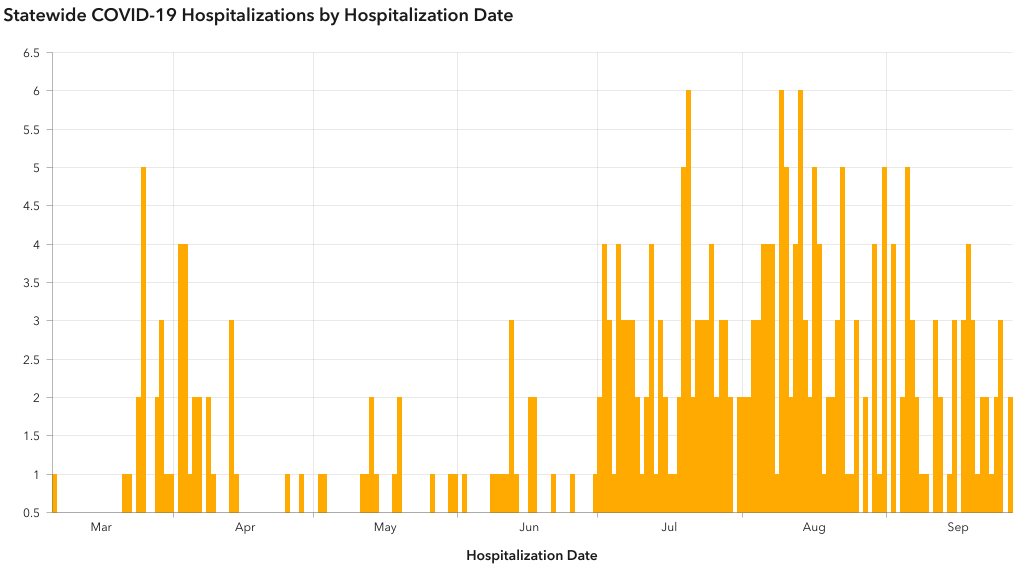
- Cumulative hospitalizations increased to 283 with 21 new this week, more than the increase of 16 last week.
- Deaths among Alaska residents increased by 11 to 56 total, a 20% increase in a single week.
- There were 19 nonresident cases identified this week, for a total of 950.
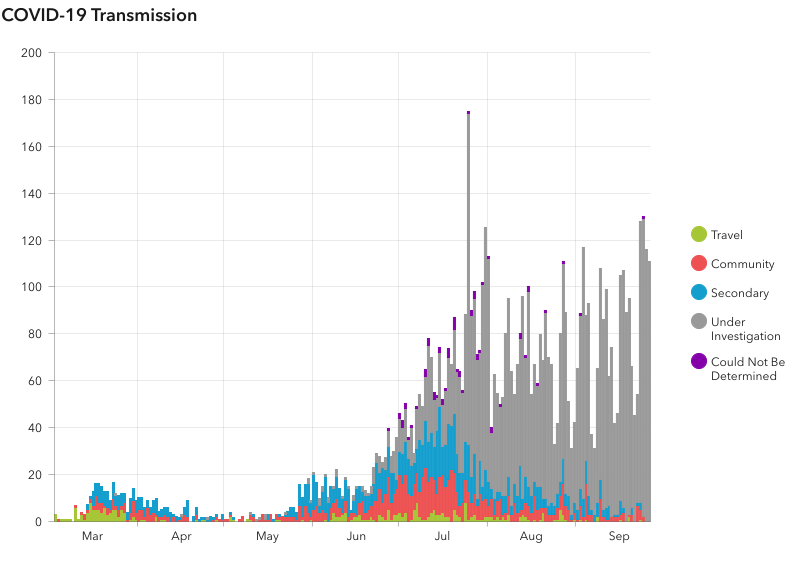
How COVID-19 spreads in Alaska
- The majority of new infections among Alaskans are from community spread, not from travel. Most Alaskans get the virus from someone they work, socialize, or go to school with.
- Many cases do not have a clear source, meaning that contact tracers have not been able to identify where the person got the virus. This could mean that there are cases in our communities that we do not know about.
- Many Alaskans who are diagnosed with COVID-19 report that they went to social gatherings, community events, church services and other social venues while they were contagious but before they knew they had the virus.
- The distribution of cases among people of different races and ethnicities has not changed significantly since last week.
- Cases continue to increase most rapidly in young adult Alaskans, especially those aged 20-29, and among Alaskans 10-19 and 30-39.


Distribution of cases compared to population distribution and distribution of cases, hospitalizations and deaths by race and ethnicity
Includes data from all cases reporting one or more races. Based on these data, American Indian and Alaska Native as well as Native Hawaiian and Pacific Islander populations are disproportionately affected. One factor limiting interpretation is that a greater proportion of tests from the Alaska Native Tribal Health system currently have race indicated than tests from other sources, which may mean that cases in Alaska Native People are more likely to be reported as such than cases in people who receive care through non-tribal health systems. However, this should not significantly impact Native Hawaiian and Pacific Islander population case counts. Currently, cases in this population are four times what would be expected based on estimated population (6.2% vs 1.4%).
If race or ethnicity is not identified with the initial test, contact tracers will attempt to collect this information, but these data are often delayed resulting in many cases (currently 2,602, or 35%- improved 10% from last week) still labeled under investigation or unknown. Additionally, people who are hospitalized or have died with COVID-19 are more likely to have a race identified. Because many cases that previously had unknown race or ethnicity now have an identified race or ethnicity, numbers of cases in different race and ethnicity categories have increased since last week beyond the number of new cases, so these numbers affect both newly diagnosed and newly categorized but previously counted cases.
*Based on US Census Bureau 2019 estimates: https://www.census.gov/
**By federal convention, ethnicity is not mutually exclusive of race, so cases identifying Hispanic ethnicity are also counted under a race category.
***Reports the percent of cases of those for whom an ethnicity is known.
Distribution of cases compared to population distribution and distribution of cases, hospitalizations and deaths by age group
*Based on US Census Bureau 2019 estimates via Census Reporter: https://censusreporter.org/
**Margin of error is at least 10% of the total value
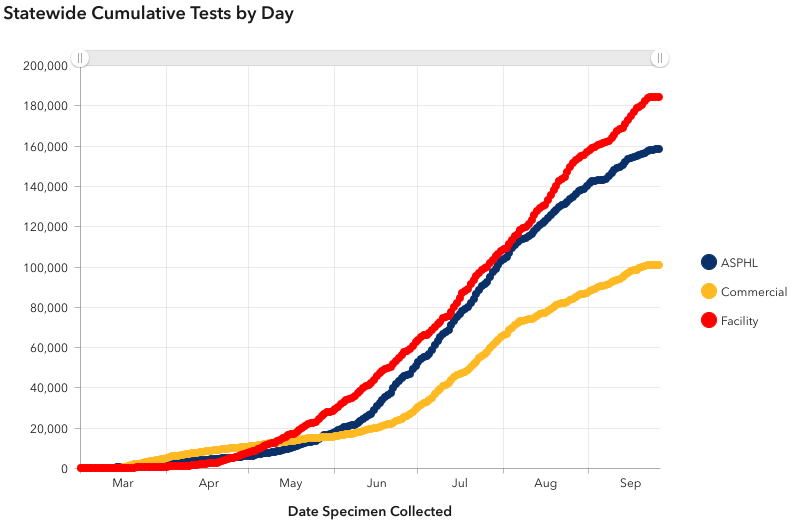
Testing trends
- Testing increased at a steady rate throughout May, June and July, but starting in mid-August, increases have slowed.
- Alaska has the capacity to continue expanding testing. DHSS can assist in materials for setting up new testing sites and is pursuing all avenues for expanding testing.
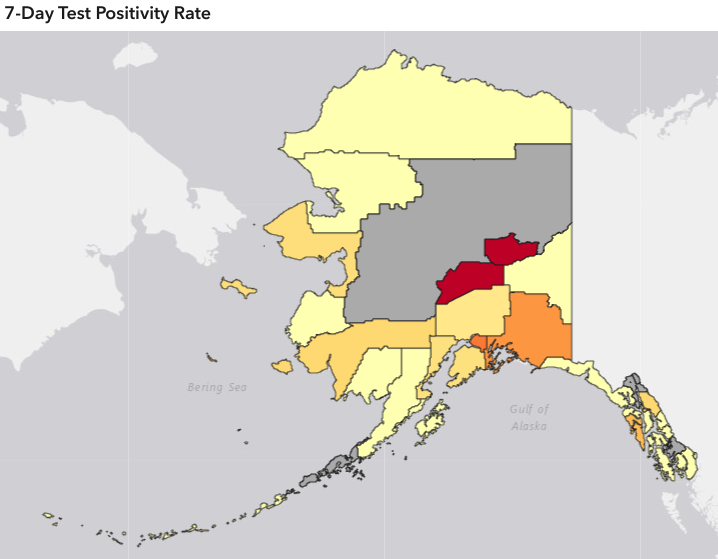
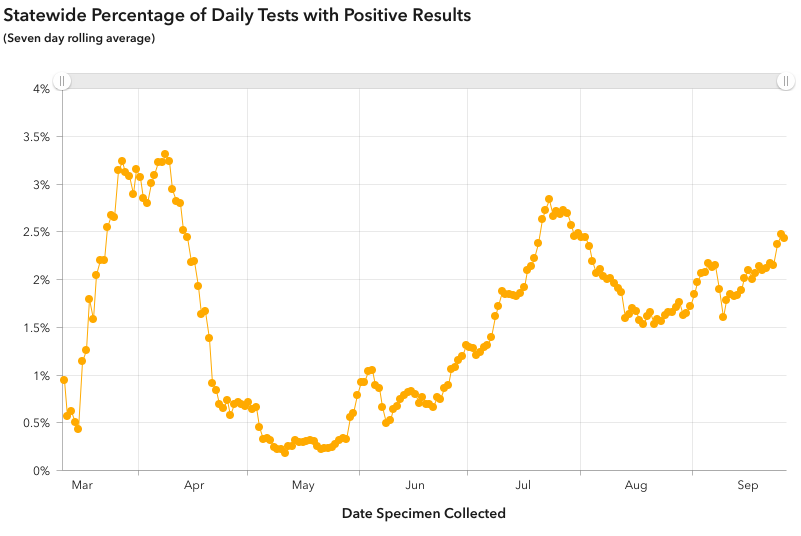
Positivity rates
- The statewide test positivity rate, calculated by dividing the number of positive tests by the total number of tests performed over a given period of time, averaged over the past seven days, increased from 2.3% to 2.4% over this last week, continuing a climb from below 2% in early September. Statewide test positivity has not been above 3% since April, and has never exceeded 3.5%.
- This is significantly better than the current national average test positivity rate of 5.0%. In comparison to other states, South Dakota currently has a positivity rate of 25.5%, while New York, which peaked at 50.7% in early April, has greatly expanded testing since then and currently has a positivity rate of 1.0%. Source: Johns Hopkins
- Of boroughs or census areas in the high risk zone, the reported test positivity rate is currently highest in the Fairbanks North Star Borough, with a rate of 6.0%, significantly worse than their rate of 4.8% last week. Anchorage Municipality has a test positivity rate of 2.8%. The Juneau City and Borough’s positivity rate is 0.96%, improved from 1.6% a week prior. The North Slope Borough’s reported test positivity rate of 0% is not consistent with the rise in cases seen this week, with 265 new cases reported in the last week, and reflects insufficient reporting of data.
- Test positivity is a good measure of whether testing is adequate in a given area, since it is affected by the number of tests performed as well as the number of new cases in an area. However, because it depends so much on the number of tests performed, it tells us more about whether we are doing enough testing than about how much virus is spreading in a community. It cannot be used to compare the amount of virus spread in one state to another, but it can be used to compare whether different states are doing adequate enough testing to be able to measure their case rate. It is also affected by any delays in reporting, since positive tests are sometimes reported faster than negative tests. A case rate can give good information about how much virus is spreading in a community, as long as the test positivity is low, so these measures can work together to help us understand the spread of virus in a community. A community test positivity rate under 5% is currently generally accepted as being low enough to estimate that a community’s case rate is reasonably accurate.
- In late August, Alaska led the nation in most tests per capita and continues to be among the top 3 states in tests per capita. Alaska’s high testing rates likely affect our hospitalization and death rates, since in places where tests are restricted to people who are very ill, many asymptomatic or mildly symptomatic COVID-19 cases are missed. In Alaska, testing is somewhat more available in many communities than in many communities in the lower 48, so we may detect more COVID-19 cases relative to the real number of people with COVID-19 than in states that do less testing per capita. Hospitalization and death rates are calculated by dividing the number of people who were hospitalized or who died by the number of people in that group that were known to have COVID-19, regardless of the severity of their illness.
- We do not have a reason to believe that the strains of COVID-19 are any less virulent in Alaska than elsewhere; in fact, in the genetic studies done so far of COVID-19 strains circulating in Alaska, virus that was as virulent or more so than that circulating in the Western United States was identified. This means that the virus present in many communities in Alaska has the ability to make people of all ages very sick if it is allowed to continue to spread.
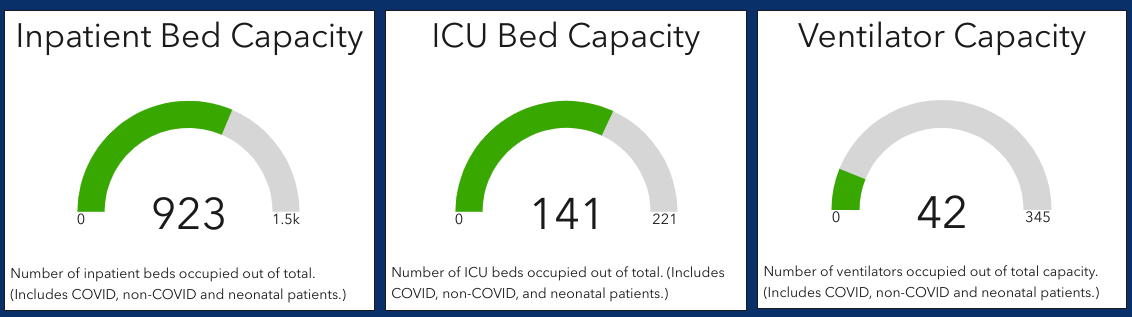
Health care capacity
- Hospital bed occupancy statewide remains steady. Hospitalizations peaked in early August and have plateaued since then. Ventilator capacity remains adequate overall. Hospital data includes inpatient beds and ventilators located all around the state, including some in smaller hospitals without ICU capacity. As of recent changes in reporting implemented September 27, 2020, hospital bed counts below currently include staffed beds only. Previous counts had included all beds, regardless of staffing. ICU bed counts below currently include NICU beds, which can be used only for infants, as well as pediatric and adult ICU beds.
- Hospital occupancy below is based on data from September 27, 2020, as data from September 26, 2020 was not available due to a shift in reporting systems. An updated version of the confirmed COVID beds occupied graphic was not available in time for this report, however occupancy has not significantly changed this week.
What Alaskans should do
- Anyone with even one new symptom of COVID-19 (fever, chills, cough, shortness of breath, difficulty breathing, fatigue, muscle aches, body aches, headache, new loss of taste or smell, sore throat, congestion, runny nose, nausea, vomiting, or diarrhea), even if it is very mild, should get tested for COVID-19 right away. Tests are most accurate in the first few days of symptoms, and if the test is positive, getting tested right away helps contact tracers move as quickly as possible.
- Alaskans can help contact tracers work to slow the spread of COVID-19 by answering the phone promptly if contacted and providing accurate information.
- Alaskans should avoid gatherings, wear masks when around any non-household member, keep six feet of distance from anyone not in their household and wash hands frequently to slow community transmission of COVID-19.
Support this site and make a small donation (and you'll receive the POW Court Report in an email)


No comments:
Post a Comment
Note: Only a member of this blog may post a comment.